
Dan Cwalinski
Director of Contracts and Pricing
Freedom Energy
ISO-NE’s Internal Market Monitor (IMM) released their quarterly markets report on January 31, 2023, assessing the state of competition in wholesale energy markets operated by ISO-NE (Independent System Operator New England). This most recent report covered the fall 2022 quarter, running from September 1, 2022, through November 30, 2022.1
For the period, the total wholesale market cost of electricity was $2.39B, which is a 9% increase over the $2.19B in fall 2021. The overall cost of load served in fall 2022 was $89/MWh compared to $79/MWh for fall 2021.
Wholesale market energy prices were stable across all load zones, with energy prices at the Hub up 12% from the same quarter the prior year. Day-Ahead Locational Marginal Pricing (DA-LMP) averaged $60.58/MWh, and Real-Time Locational Marginal Pricing (RT-LMP) averaged $60.28/MWh. Fall 2021 had DA-LMP pricing of $54.18/MWh and RT-LMP pricing of $53.87/MWh.
The 12% increases in DA & RT LMP pricing can be attributed to wholesale electricity pricing tracking the higher year-over-year natural gas prices, averaging $6.00/MMBtu in the fall of 2022. This $6.00/MMBtu price represents an 18% increase over the fall 2021 price of $5.07/MMBtu. The fall 2022 average natural gas price was the highest since the fall of 2008. For comparison, natural gas prices in the fall of 2020 averaged $1.93/MMBtu, the lowest fall price since the fall of 2001.
While natural gas prices were higher in fall 2022 than in fall 2021, there were fewer nuclear outages; the average hourly load was down 3.4% (428 MW), and peak loads were down 11% (2,294 MW). In addition, behind-the-meter photovoltaic generation increased by 58 MW (374 MW vs. 316 MW), contributing to an overall lower wholesale load. All of this helped soften the effect of higher natural gas pricing on DA and RT LMP pricing this past fall.
In fall 2022, the generation fuel mix consisted of 27% Nuclear, 11% Net Imports, 46% Natural Gas, and 6% Hydro, with Solar, Wind, and Other representing the remaining 10% of generation. The fall 2021 generation fuel mix consisted of 20% Nuclear, 14% Net Imports, 50% Natural Gas, and 6% Hydro, with Solar, Wind, and Other representing the remaining 10% of generation.
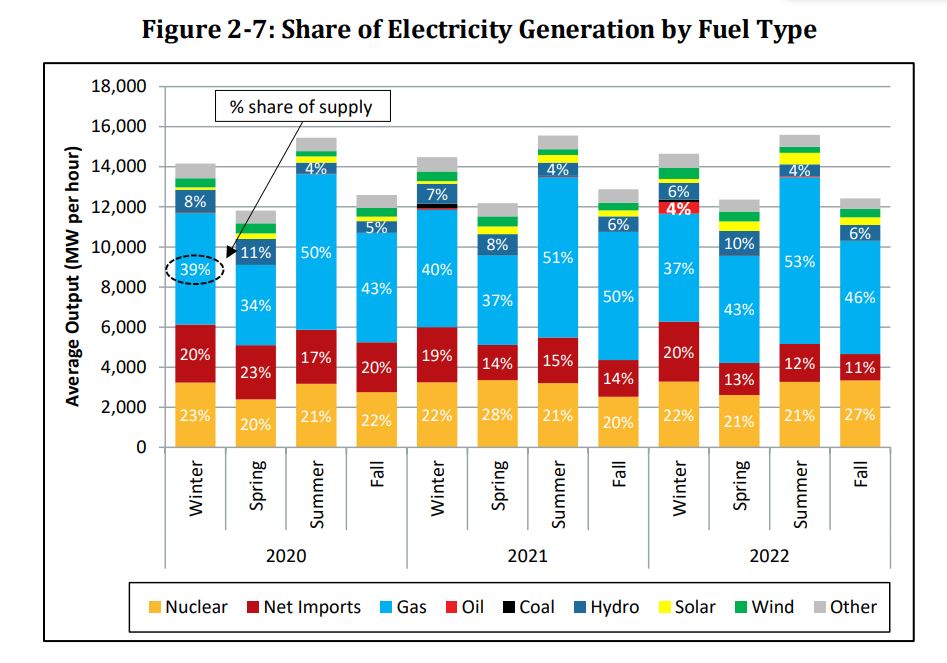
Nuclear generation was 811 MW per hour higher (3,338 MW in Fall 2022 vs. 2,527 MW in Fall 2021). During the fall of 2021, two nuclear generators were out of service while they refueled. Still, there were no such nuclear generator refueling outages in the fall of 2022, allowing for the increased nuclear generation seen year over year. Natural gas generation was down 720 MW per hour (5,670 MW Fall 2022 vs. 6,389 MW Fall 2021), which can be attributed to the increased nuclear generation.
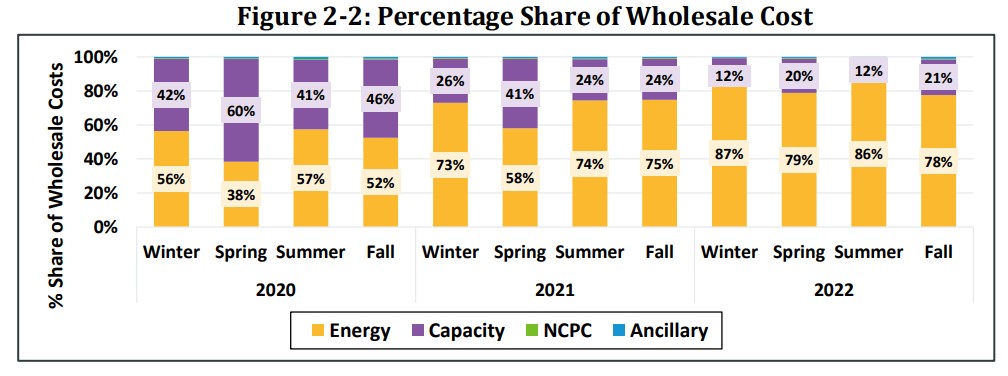
Capacity costs for the Fall 2022 period totaled $501M, which also includes $77.6M in supplemental payments to the Mystic 8 & 9 generators. This equates to a capacity price of $19/MWh and represents 21% of the total wholesale energy cost for the period. The Fall 2021 capacity cost was about 24% of the total wholesale energy cost. The Fall 2022 period had an 18% lower primary capacity auction clearing price than Fall 2021 ($3.80/kW-Month versus $4.63/kW-Month), but the mere 3% reduction in capacity costs, is reflective of this period, also including payments for the Mystic 8 & 9 generators.
The average monthly load was lower for all three 2022 fall months. The most significant decrease in average monthly load occurred in September 2022, which saw a 705 MW decrease from fall 2021. Temperatures in September 2022 averaged 64° F, representing a decrease of 3° F from September 2021 with an average temperature of 67° F. This led to 25 fewer cooling degree days (CDD), from 76 to 51, and thus lowering demand for air conditioning. October 2022 average load was lower by 299 MW (11,644 MW) and November 2022 by 285 MW (12,415 MW). During those months, the CDDs and HDD (heating degree days) were similar year-over-year, illustrating that weather had a negligible impact on load. The load decreases are consistent with the growing behind-the-meter solar and energy efficiency in New England.
The next IMM Quarterly Markets Report covering the Winter of 2023 (December 1, 2022, through February 28, 2023) should be available in early May 2023.
Published: March 17, 2023

Connect With Us