
New England Spot Market, Futures Electricity and Natural Gas Price Summary
Authored by Howard Plante | Vice President of Procurement
New England Spot Market and Futures Electricity and Natural Gas Price Summary
The temps for the summer beginning June started off a bit lower than what we typically see. In many years, that first heat spell (not technically a heat wave of three 90° days consecutively) seems to hit in the second or third week of June. This year the first considerable hot stretch didn't hit until June 30th/July 1st through July 4th with temperatures over 90°F up to 100°F depending on location. After the 4th, with the exception of a few days in mid-July and early August, temperatures were relatively moderate.
Natural gas daily cash prices in the spot market were relatively stable as expected for the summer period, with a few spikes in the $10-$12 per dekatherm range on the extreme temperature days.
Spot Market Wholesale Electricity Prices
Spot market electricity prices June through August averaged 5.3 cents per kWh with a high of 47 cents at 5 PM on July 2nd. While July produced the highest price for the summer, it also had the lowest price at 0.5 cents per kWh. Unlike the period March – May where there were 51 negative priced hours, there weren't any this summer.
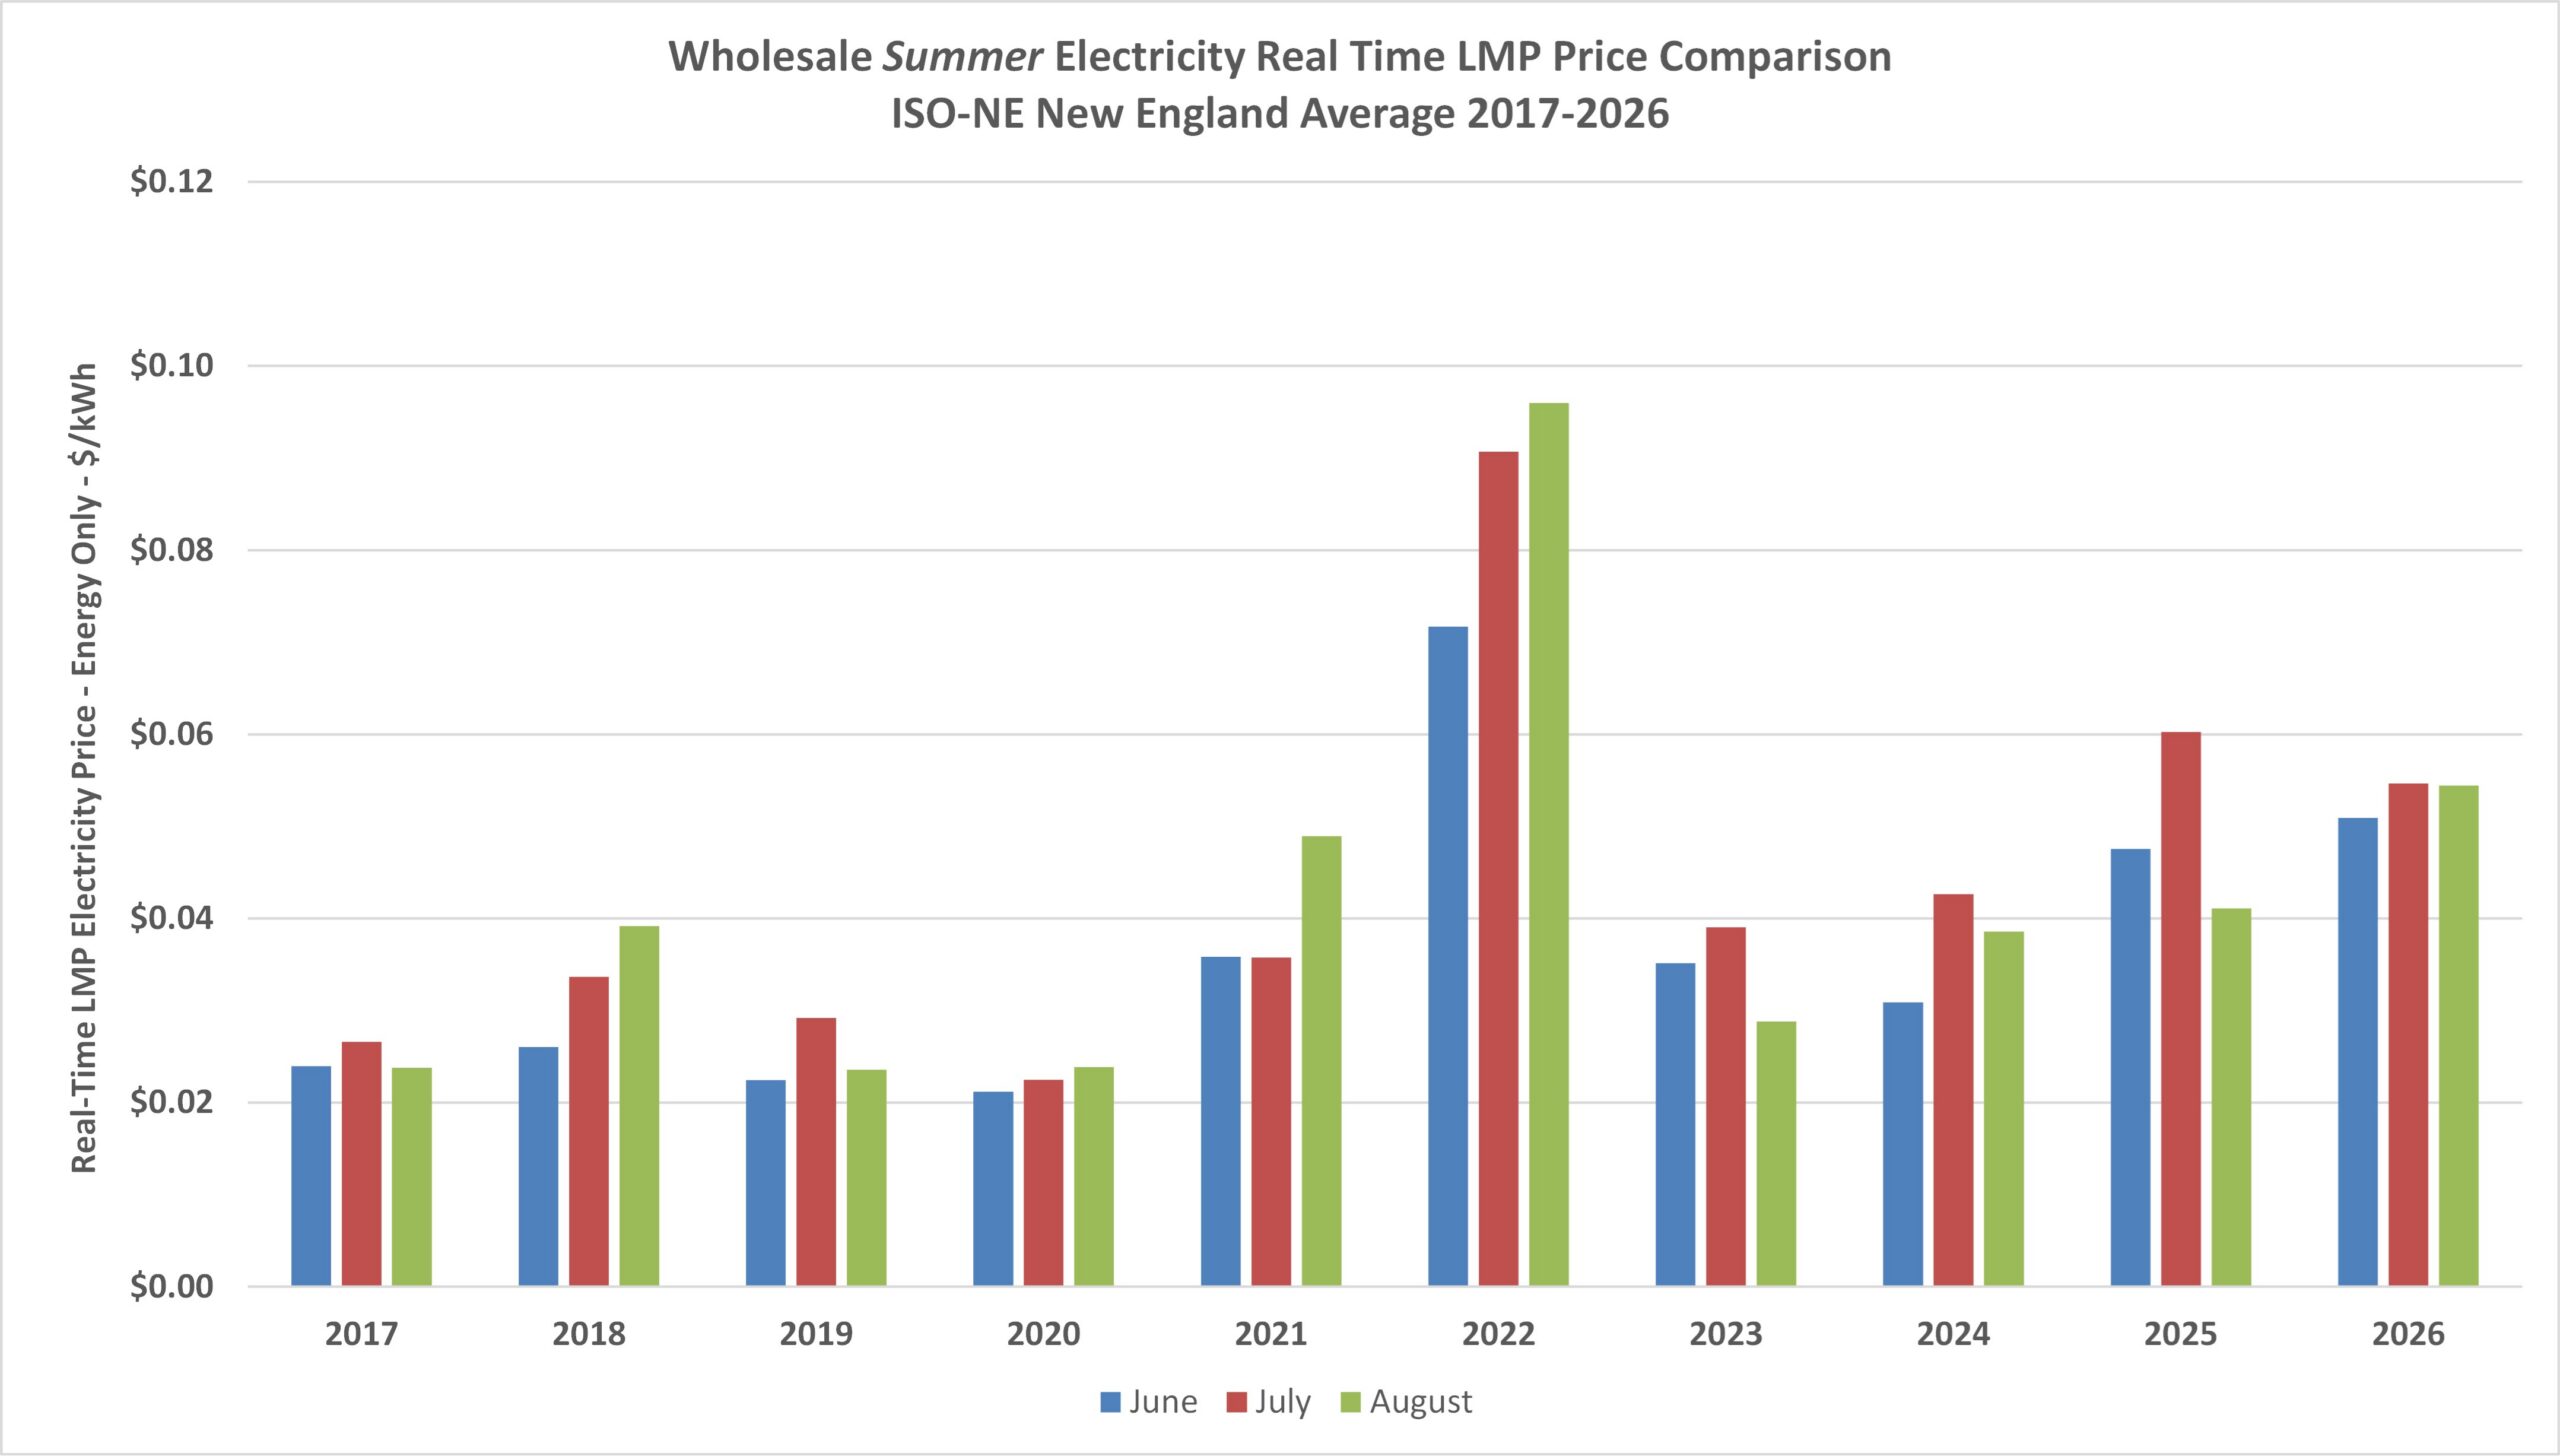
Table 1 depicts average monthly wholesale electricity prices for the three-month period June – August for the past 10 years. (2017 through 2026)
This summer reflects an overall average price that is the second highest for the ten-year period 2017 – 2026. That was the same trend we saw for the March – May period coming in second as well.
Day-Ahead Ancillary Services (DAAS) prices continued to average lower than the same period last year at 0.21 cents per kWh June-August 2026, compared to 0.44 cents per kWh June-August 2025. This drop potentially reflects the first of the three reforms that was implemented May 1, 2026 (the second and third reforms expected late October).
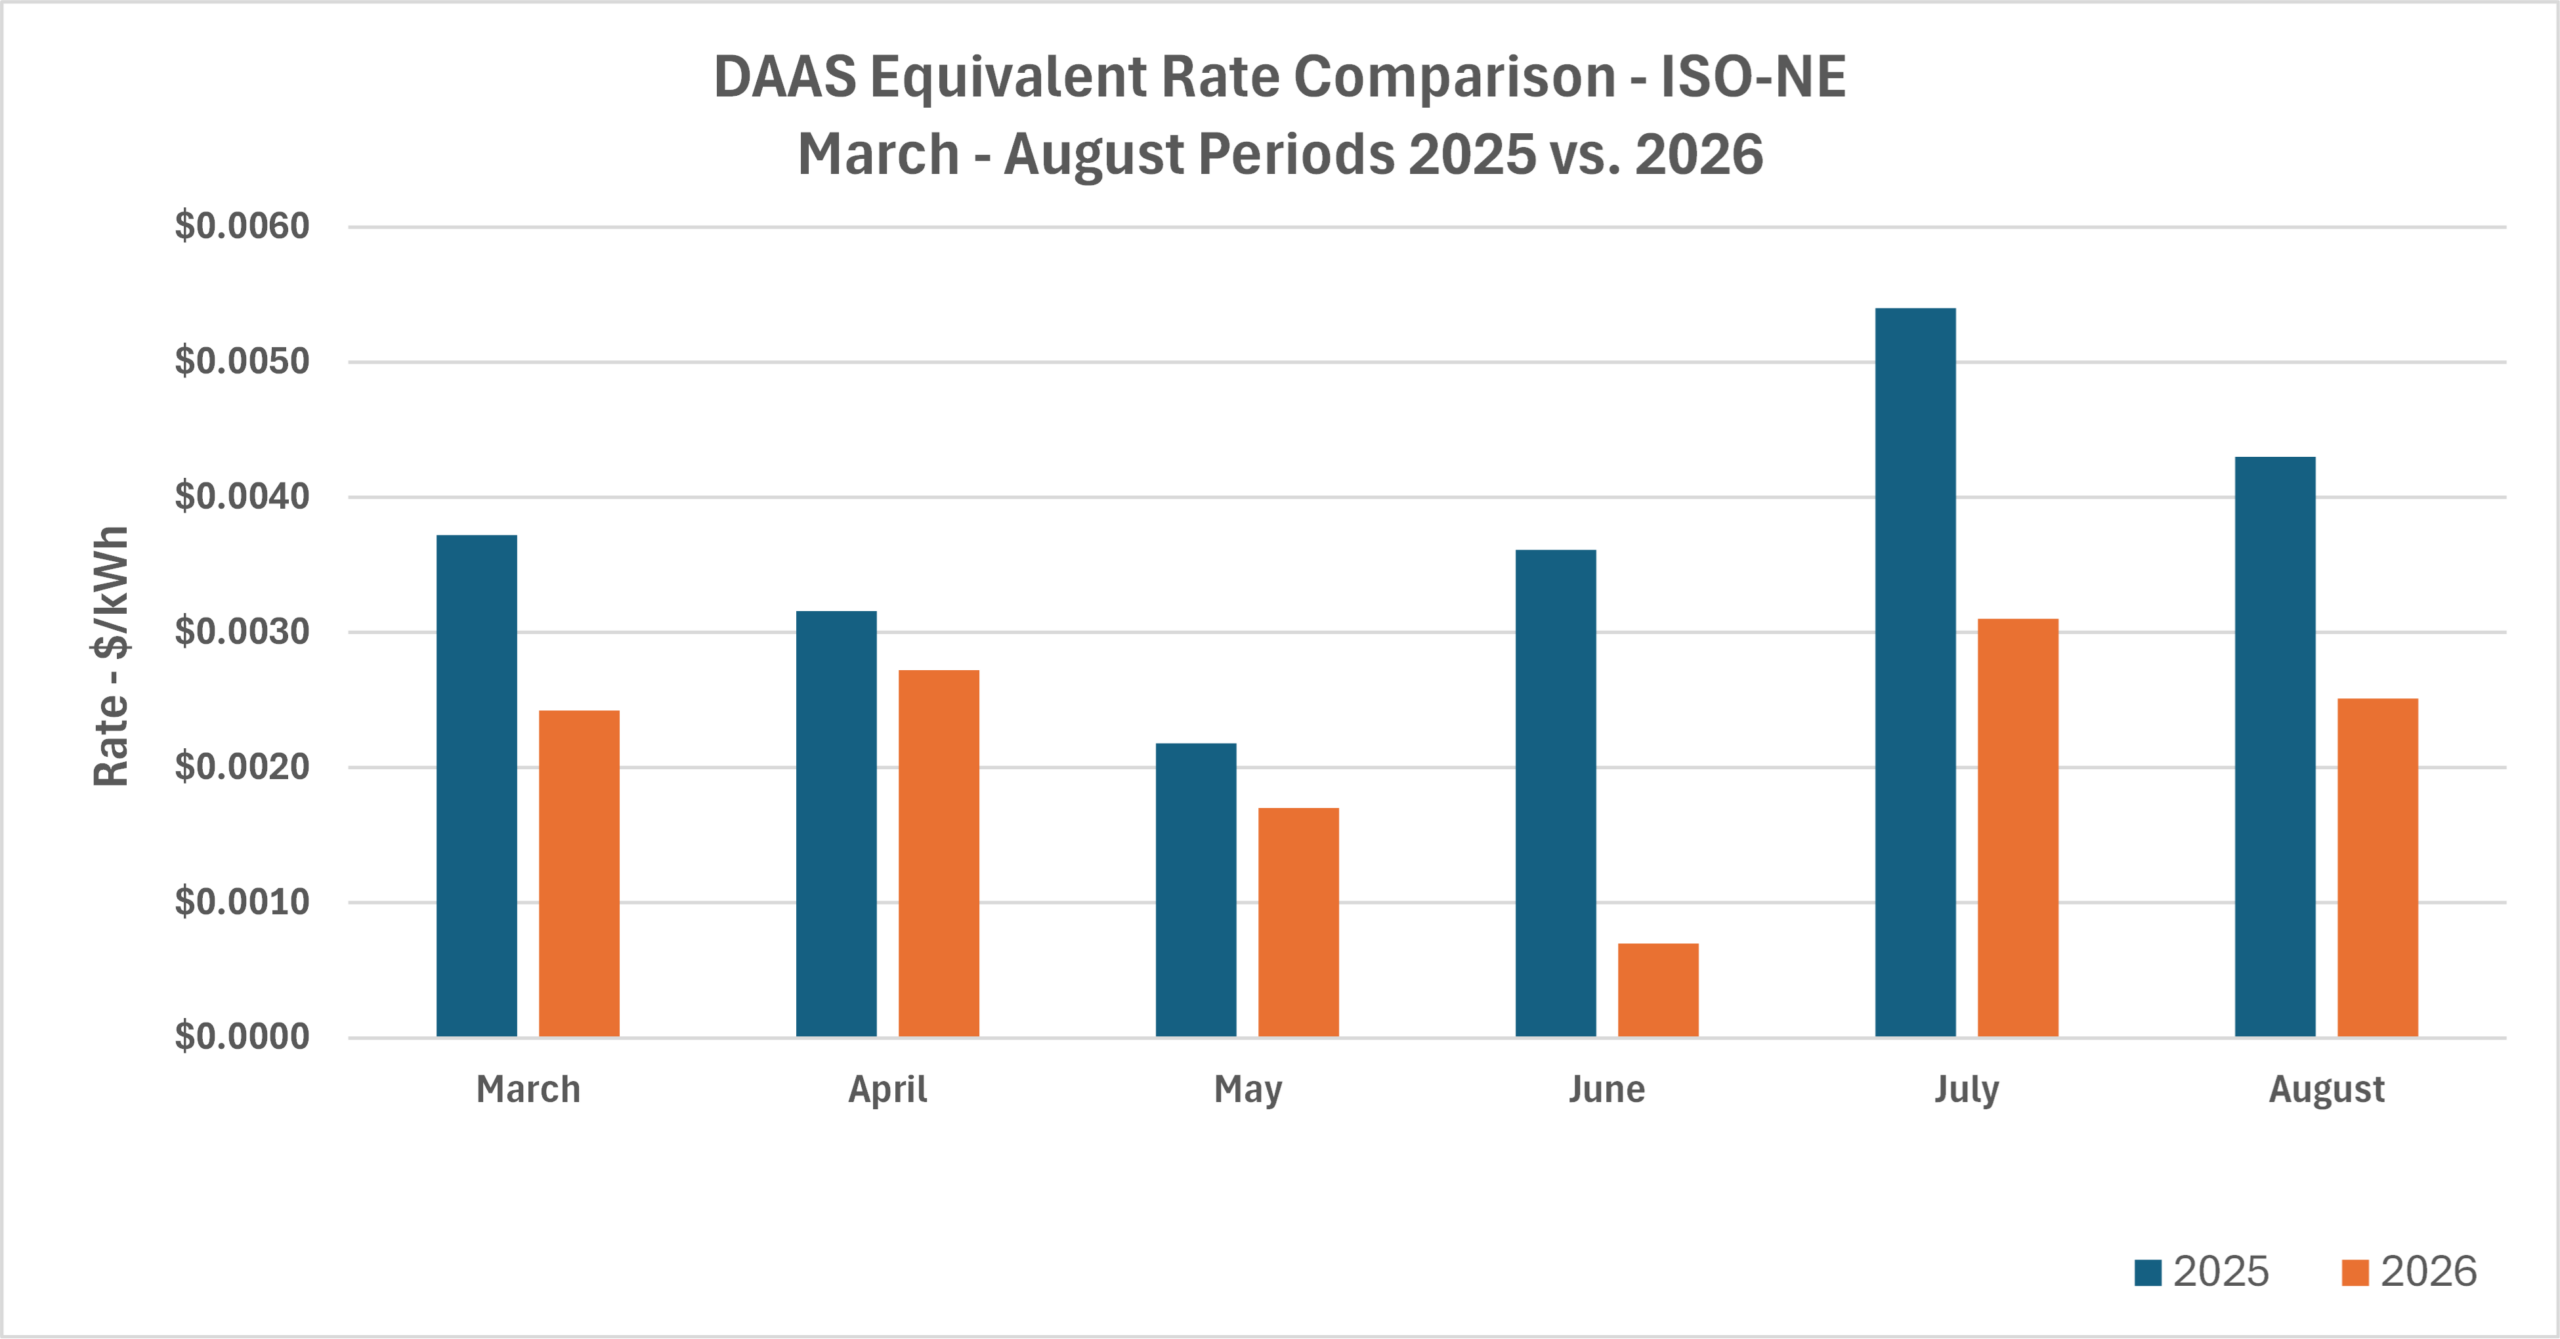
Table 2 depicts the DAAS prices for the same months in 2025 and 2026.
Future Energy Price Trends Across 2027, 2028 and 2029
The Futures electricity price for calendar year 2027 at 8.25 cents per kWh (as of Sep 11, 2026) is well above the high that we saw back in the Fall of 2022 when the 2027 strip reached 7.64 cents. Futures prices continue on an upward trend with day-to-day volatility resulting primarily from the Iran war and the swings in oil prices affecting electricity prices for Jan and Feb 2027. The risk of oil generation requirements persists if we have another cold winter (oil was the marginal fuel for several days this past winter). NOAA’s forecast for a mild winter due to a high confidence in a very strong El Nino seems to be taking a back seat to the risk of oil dependance on potentially cold days. A mild winter for a three-month period average doesn’t mean the complete absence of some very cold days where oil could set the marginal price in the spot market. Interesting to note that September 11th broke the record for a hurricane to have not formed by then in the Atlantic basin. Prior to September 11th this year, the two latest first hurricanes to form in the Atlantic basin were Gustav in 2002 and Humberto in 2013, oddly both reaching hurricane strength on September 11th (during the modern satellite era since 1966).
Futures prices for Calendar years 2028 and 2029 are trading well below 2027 but have also continued to trend upward since mid-May 2025. If the Iran war persists, we’ll likely continue to see weekly volatility in the futures market, particularly for 2027.
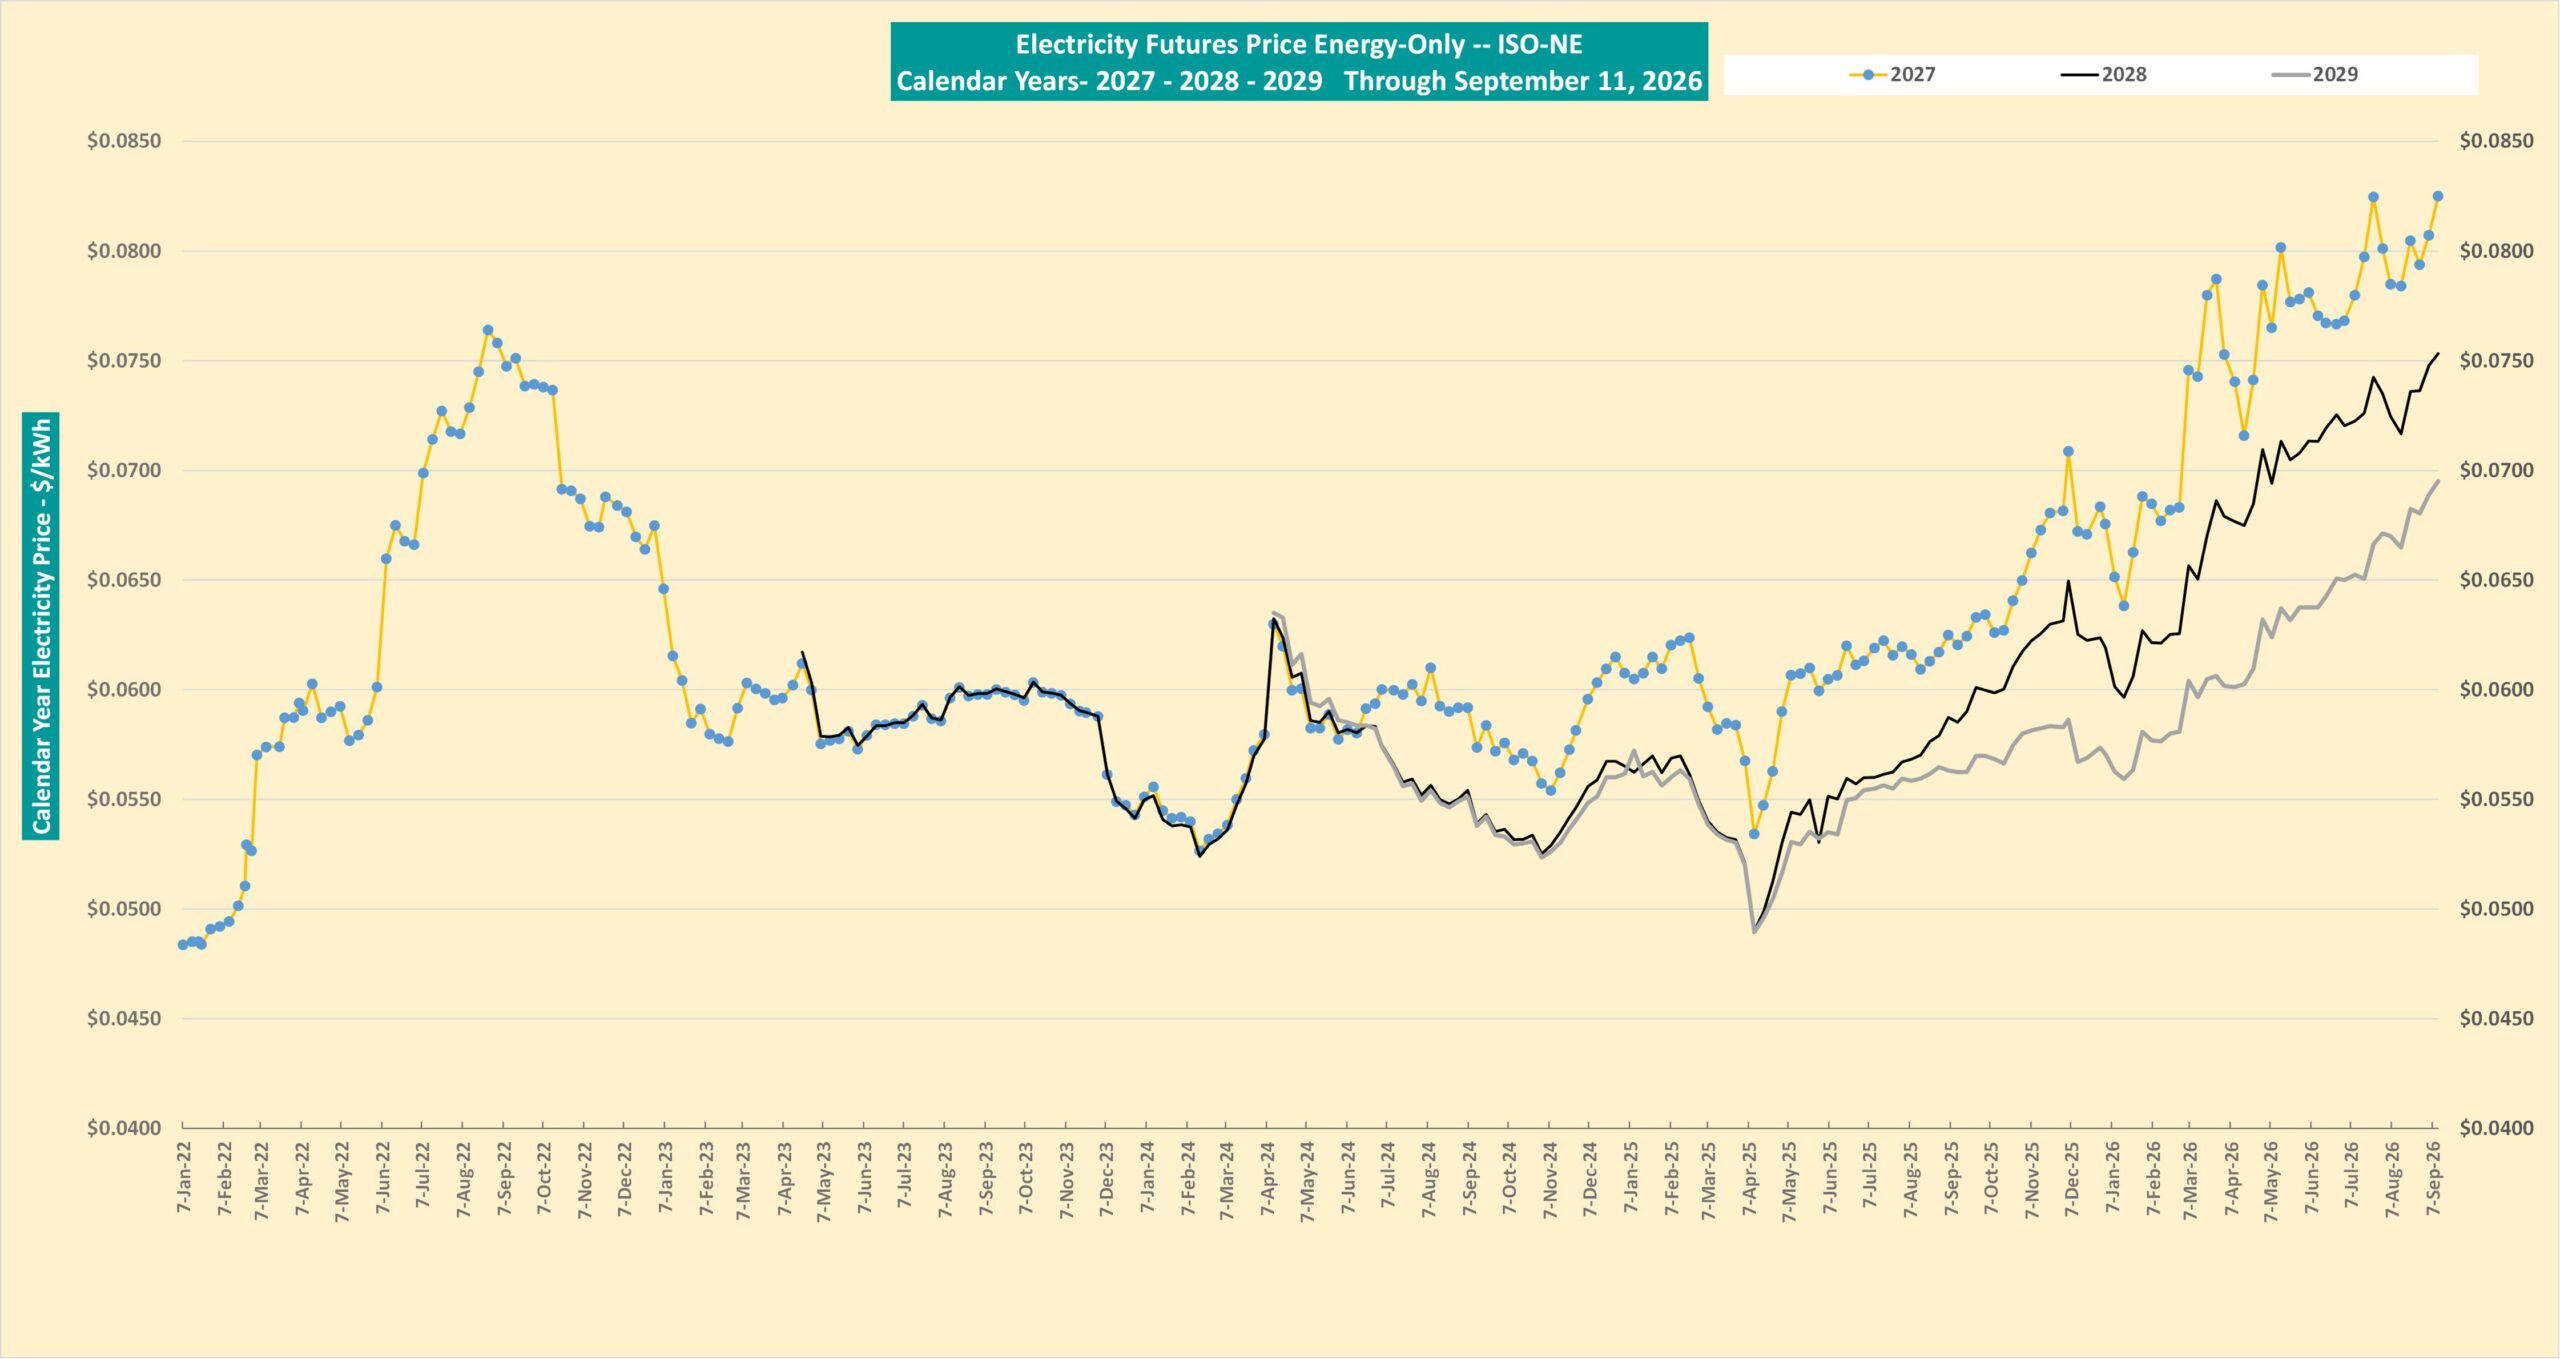
Table 3 depicts electricity futures prices for Calendar years 2027, 2028 and 2029 as of September 11.
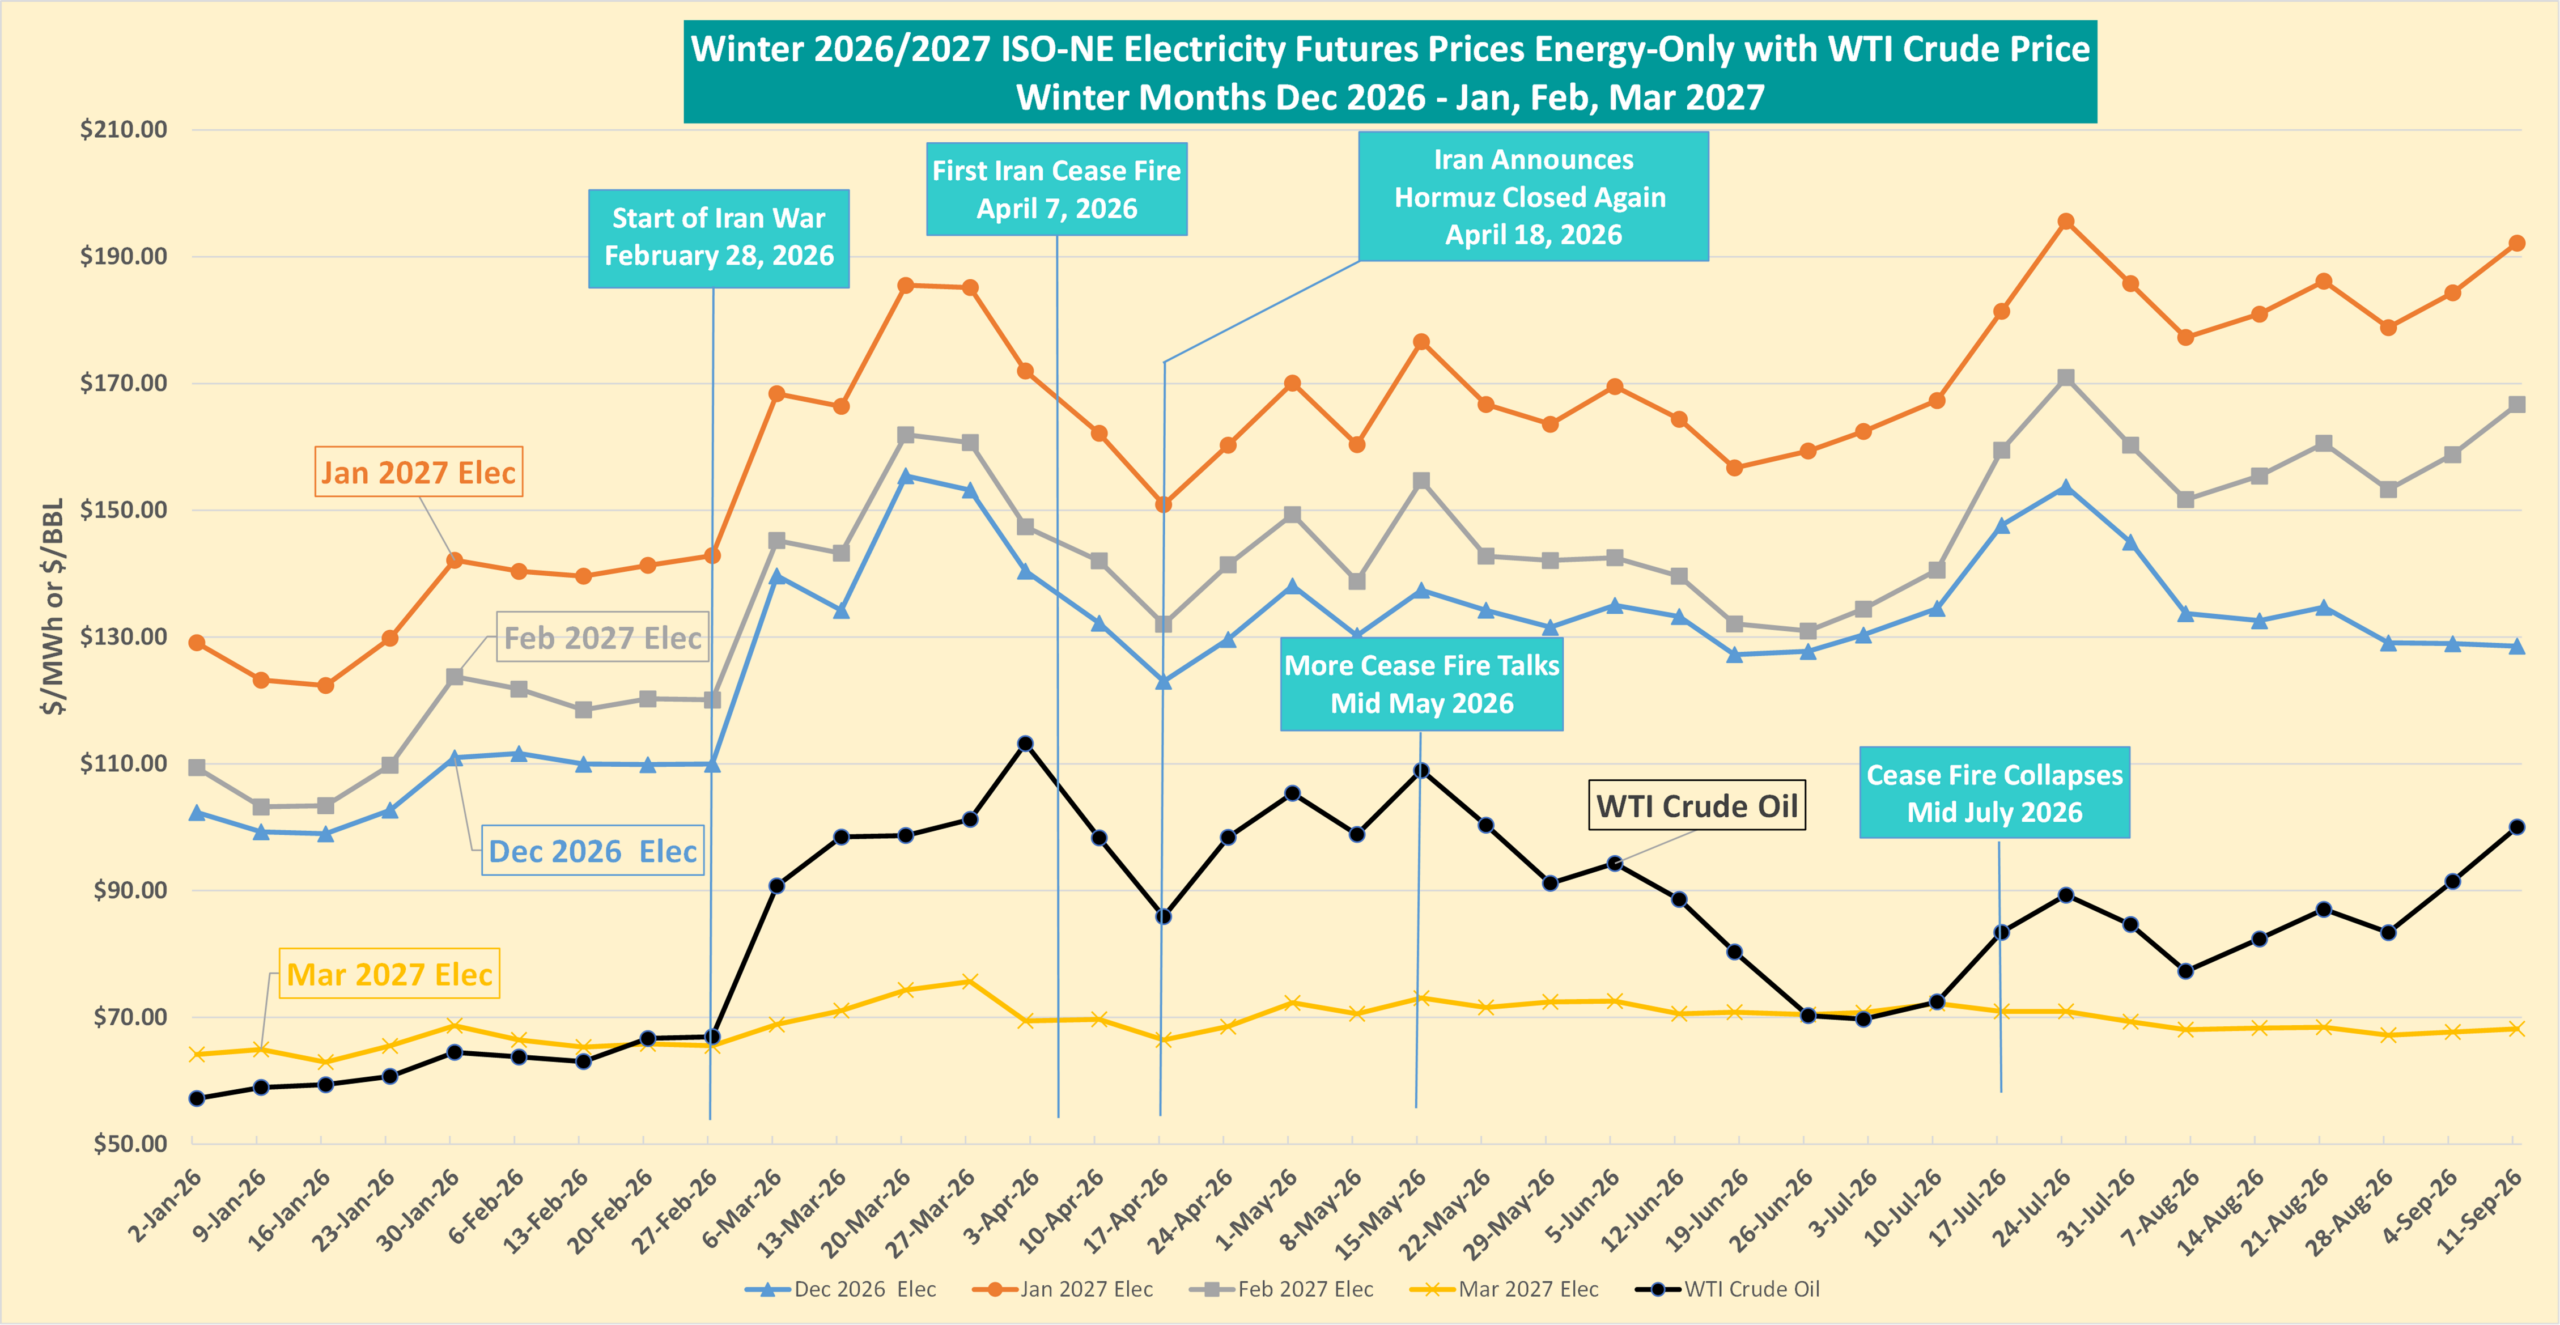
Table 4 depicts Winter 2026/2027 electricity futures prices compared to WTI Crude Oil prices as of September 11. December electricity futures has settled down a bit, but January and February continue to follow oil. March appears to be unimpacted.
Natural Gas Futures
Natural gas futures prices for 2027 continue on a downward trend that started at the end of March. There was a short-lived rebound through June before the slide continued, now at a 4.5 year low.

Table 5 depicts natural gas futures prices for Calendar years 2027, 2028 and 2029 as of September 11.
We continue to see a further divergence of New England electricity prices tracking compared to natural gas prices.
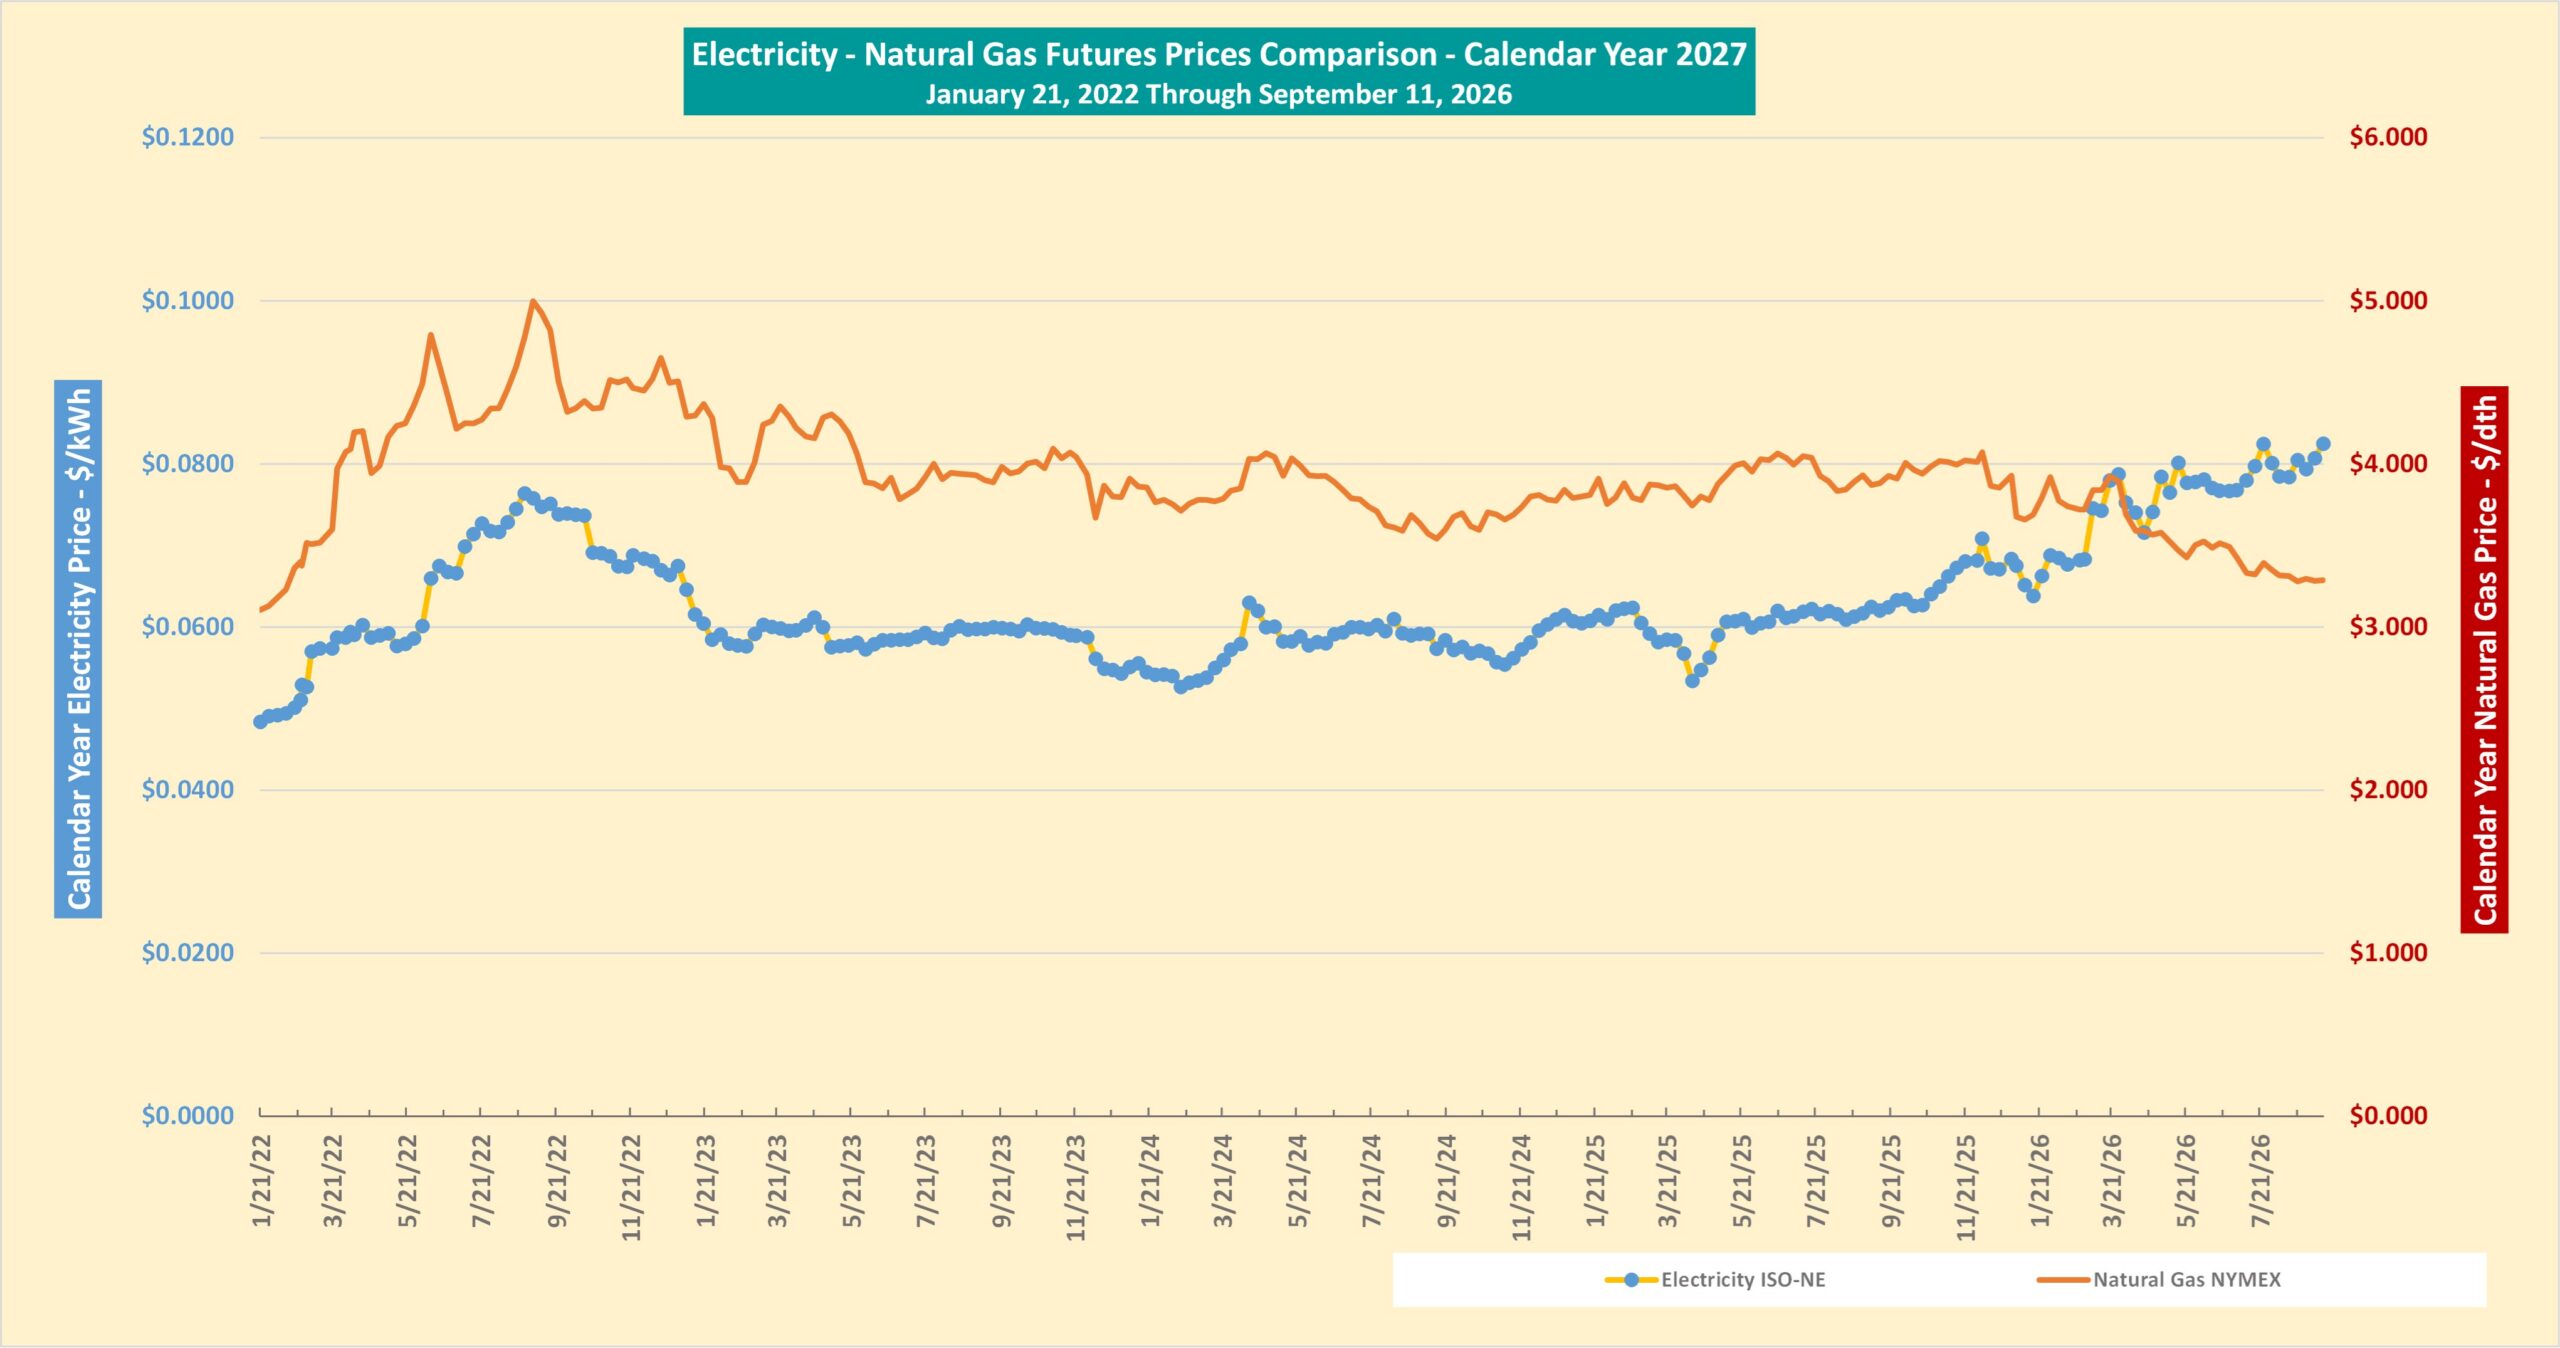
Table 6 depicts the continued divergence between the two for the 2027 futures.
Natural Gas Storage
Injections into storage over the summer fluctuated from strong to weak builds weekly, but overall in relatively good shape heading into the winter. Although storage is below where it was at this time last year, EIA expects injections during the remainder of September and October to put the U.S. in a very healthy position at the traditional start of withdrawal season.
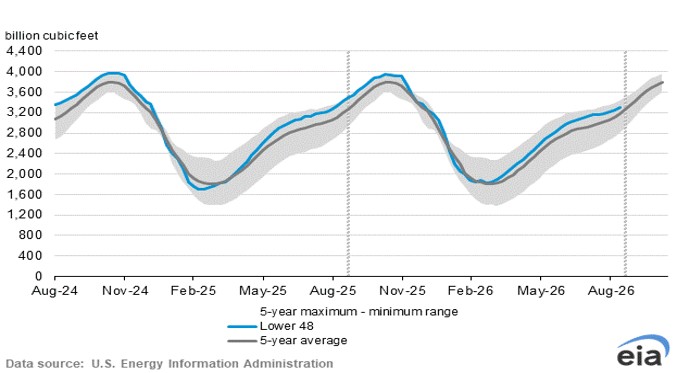
Table 7 – Natural Gas Storage Week Ending September 11, 2026
Note: Electricity prices referenced here are energy-only and do not reflect a total electricity supply price that includes capacity, ancillaries, RECs, Fuel Security, etc. Additionally, natural gas prices referenced are NYMEX only and do not include basis and capacity costs.
Meet the Writer

Howard Plante
Freedom Energy Logistics
Vice President of Procurement
Howard Plante is a seasoned professional in the energy industry with a comprehensive background in environmental and energy engineering. As Vice President of Procurement at Freedom Energy Logistics, he brings a wealth of experience in regulatory compliance, technical analysis, and strategic planning to his role, where he is dedicated to advocating for clients and advancing the company’s enterprise efforts on their behalf.







Connect With Us